Books = data.
20/01/11 13:33 Filed in: social phenomena
``Quantitative analysis of culture using millions of digitized books'' by Michel et al., Science, 2011.
More here: http://www.culturomics.org/
Data and play here: Google Books ngram viewer

More here: http://www.culturomics.org/
Data and play here: Google Books ngram viewer

``It's all about data''
05/02/10 18:55 Filed in: data
NY Times (2010-Feb-05):
U.S. Scientists Given Access to Cloud Computing
The National Science Foundation and the Microsoft Corporation have agreed to offer American scientific researchers free access to the company’s new cloud computing service.
A goal of the three-year project is to give scientists the computing power to cope with exploding amounts of research data. It uses Microsoft’s Windows Azure computing system, which the company recently introduced to compete with cloud computing services from companies like Amazon, Google, I.B.M. and Yahoo. These cloud computing systems allow organizations and individuals to run computing tasks and Internet services remotely in relatively low-cost data centers.
Full article here.
Synchronization
09/09/09 23:44 Filed in: patterns | synchronization
Steve Strogatz on all things syncful:
Political book preferences
11/09/08 08:35 Filed in: politics
Amazon has an interactive map of the US showing which political books are bestsellers as a function of state. You’ll notice that Vermont is rather blue.
The end is nigh...
10/09/08 13:27 Filed in: science
As we record more and more information about ourselves and
everything around us, Chris Anderson argues
in Wired that the end of theory is nigh.
(He’s certainly not the first to do so.)
It’s certainly true that we have moved into an age of
data abundance as far as social sciences go.
It’s worthwhile to simply dive into these streams
of data and look for patterns. Questions will naturally
appear, we will search more, and theories will form.
And while simple theories may not be available for
many problems, we at least have the task of improving the science of description.
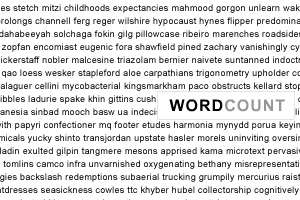
Visualization of word frequencies
18/09/10 22:17


