Tracking climate change through the spatiotemporal dynamics of the Teletherms, the statistically hottest and coldest days of the year
P. S. Dodds, L. Mitchell, A. J. Reagan, and C. M. Danforth
PLoS ONE, 10, e0154184, 2016
Times cited: 10
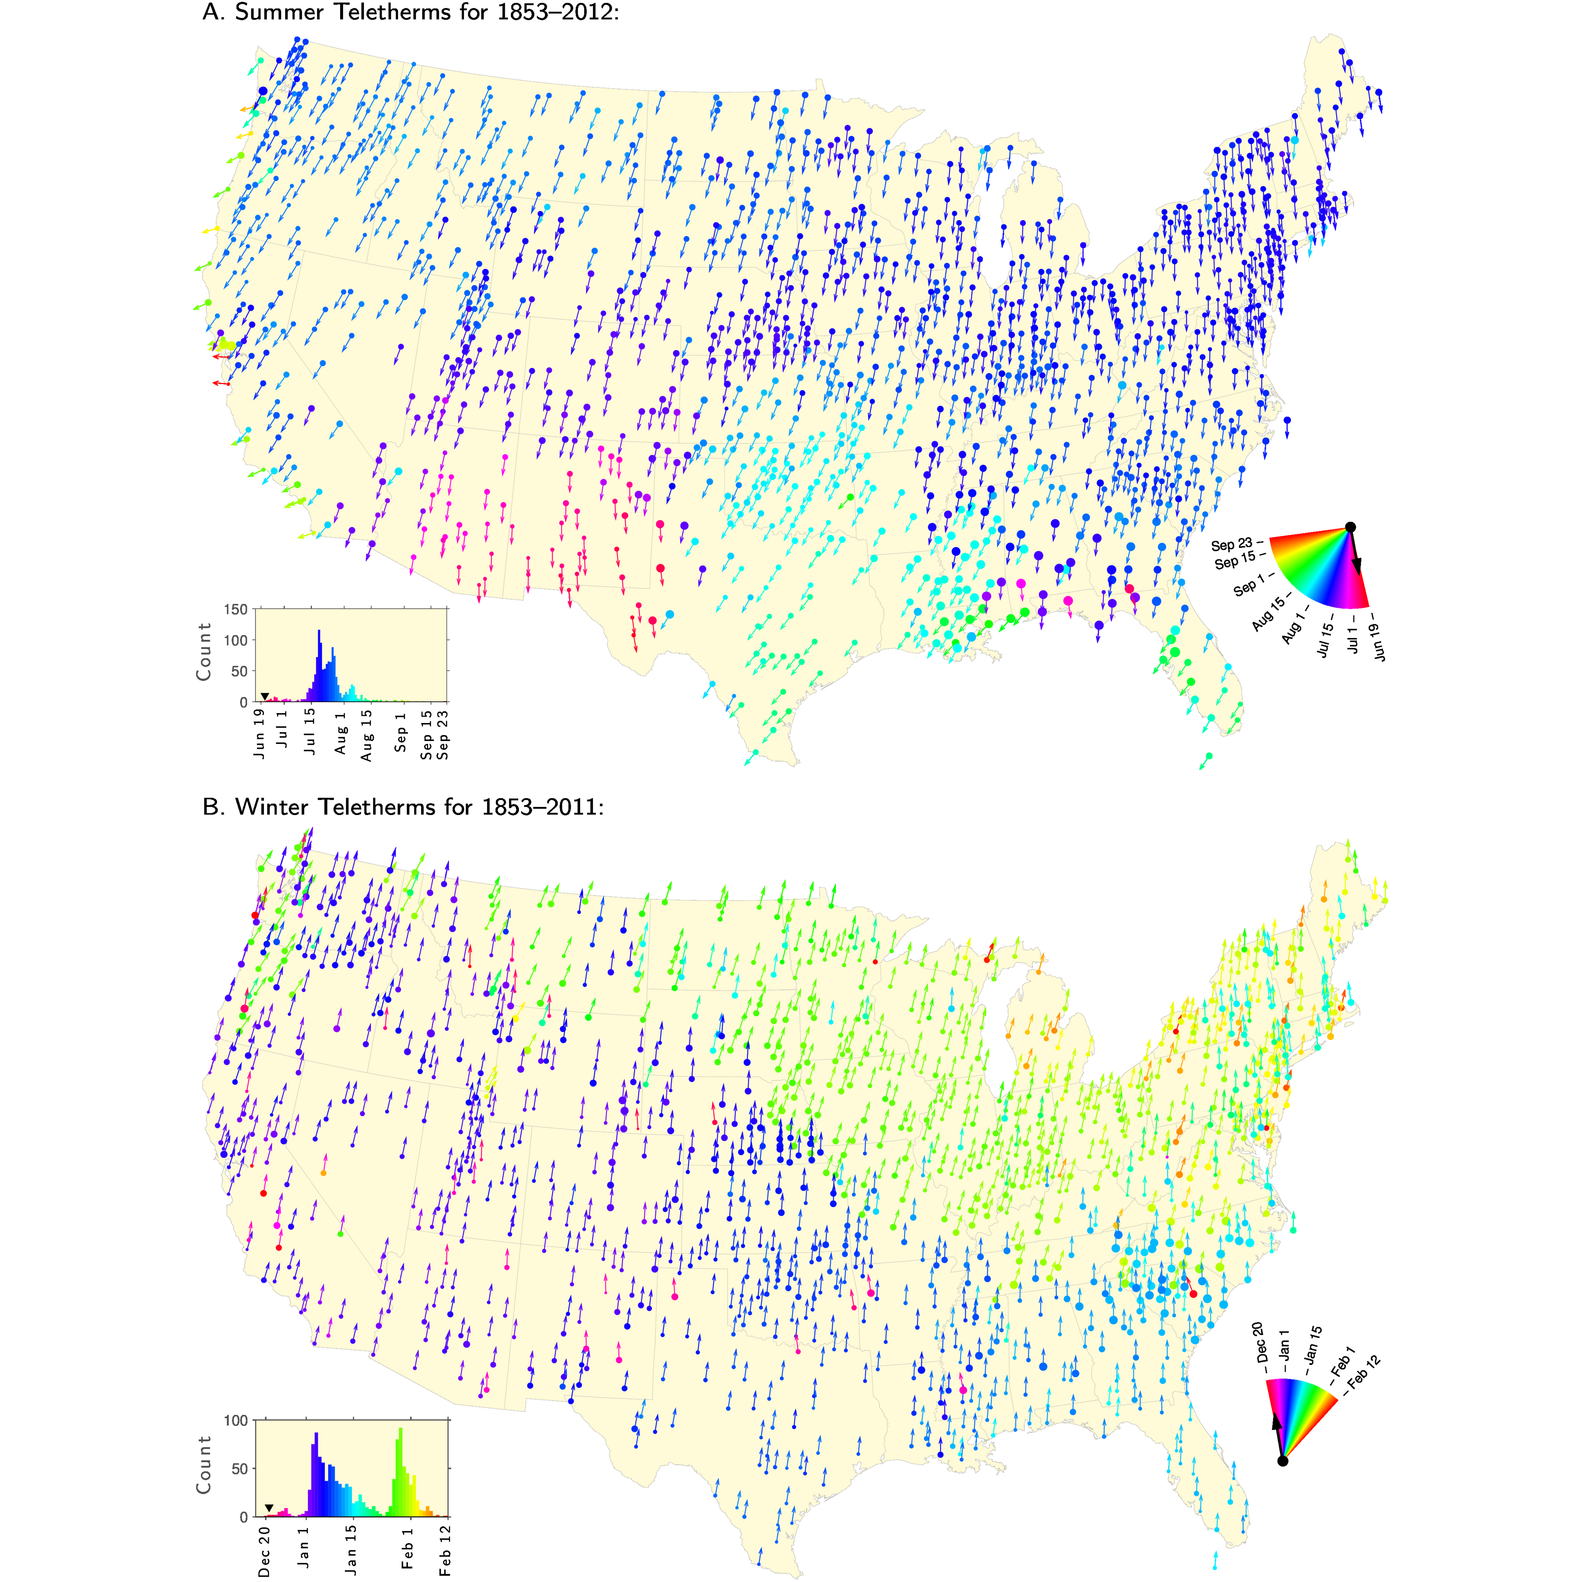
Logline: We introduce, formalize, and explore what we believe are fundamental climatological and seasonal markers: the Summer and Winter Teletherm—the on-average hottest and coldest days of the year. We measure the Teletherms using 25 and 50 year averaging windows for 1218 stations in the contiguous United States and find strong, sometimes dramatic, shifts in Teletherm date, temperature, and extent. For climate change, Teletherm dynamics have profound implications for ecological, agricultural, and people, and we observe clear regional differences, as well as accelerations and reversals in the Teletherms.
Abstract:
Instabilities and long term shifts in seasons, whether induced by natural drivers or human activities, pose great disruptive threats to ecological, agricultural, and people. Here, we propose, measure, and explore two fundamental markers of location-sensitive seasonal variations: the Summer and Winter Teletherms—the on-average annual dates of the hottest and coldest days of the year. We analyse daily temperature extremes recorded at 1218 stations across the contiguous United States from 1853–2012, and observe large regional variation with the Summer Teletherm falling up to 90 days after the Summer Solstice, and 50 days for the Winter Teletherm after the Winter Solstice. We show that Teletherm temporal dynamics are substantive with clear and in some cases dramatic shifts reflective of system bifurcations. We also compare recorded daily temperature extremes with output from two regional climate models finding considerable though relatively unbiased error. Our work demonstrates that Teletherms are an intuitive, powerful, and statistically sound measure of local climate change, and that they pose detailed, stringent challenges for future theoretical and computational models.
- This is the default HTML.
- You can replace it with your own.
- Include your own code without the HTML, Head, or Body tags.
Extra: Explore interactive visualizations of Teletherm dynamics online at http://panometer.org/instruments/teletherms/
Follow the Teletherm on Twitter: https://twitter.com/@teletherm.
Follow the Teletherm on Twitter: https://twitter.com/@teletherm.
BibTeX:
@article{dodds2016a,
  author =	 {Dodds, Peter Sheridan and Mitchell, Lewis and
                  Reagan, Andrew J. and Danforth, Christopher M.},
  title =	 {Tracking the {T}eletherms: {T}he spatiotemporal
                  dynamics of the hottest and coldest days of the
                  year},
  journal =	 {PLoS ONE},
  year =	 {2016},
  key =		 {climate,weather,teletherms},
  volume =	 {11},
  pages =	 {e0154184},
}